We did the math so you don't have to. Check it out.
Version 2.0
Version 1.0 from 2019 tested every combination of Omaha and Texas Hold'Em starting hands against a randomly drawn hand. Each Omaha hand was tested 20,000 times and each Hold'Em hand 100,000 times. The final CPU based Omaha run took 43 hours on 12 processes, writing every result to a database while the Hold'Em run only took four hours. Omaha has 204 times as many starting hands as Hold'Em and needs about three times the hand evaluations per trial. See more about runtime implications and the computational complexity of the NextGenPoker Monte Carlo Simulations here.

Version 2.0 from 2026 runs the same experiment with 1,000,000 trials per combination for both games. We rewrote the simulator with numpy, so it deals and scores thousands of hands at once, and ran it on Apple's M4 Pro CPU. It completes about 1.7 million Omaha trials a second, 48.6 times the throughput of the original run, so an experiment 50 times larger took about the same time: roughly 44 hours. Results are reported as equity, which counts a tie as half a win.
Version 3.0 will move the simulator to the GPU and add more games, including Omaha Hi-Lo, Omaha 5 and Big O, each tested the same way.
A Simple Mapping
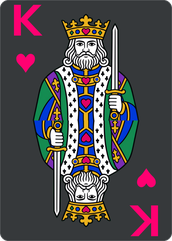
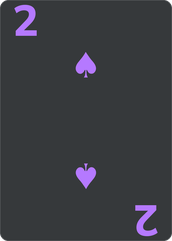
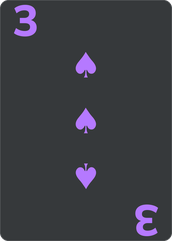
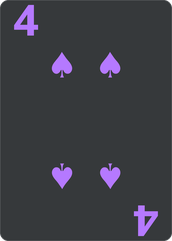
Card 1 is the 2♣, and card 52 is the A♠. A card has an index, x, a rank z and a suit suit.

1,000,000 Tests per Data Point
There are 270,725 starting hands in Omaha. At 1,000,000 trials each, that is 270.73 billion hands, run as ten independent passes of 100,000 whose results agree within random noise. Texas Hold'Em adds another 1.33 billion hands.
Every trial deals a random hand and a random five-card board from the cards that are left. In Omaha that means checking all 60 ways a player can use exactly two hole cards with three from the board. There are 211.32 billion possible opponent-board deals for every Omaha starting hand (48C4 × 44C5). We sample these combinations in a Monte Carlo simulation.
The number of trials determines the precision. At 1,000,000 trials, a hand's equity is known to within about ±0.10 points (95% confidence), fine enough to separate close hands like AATT and AAKK.
Hands that differ only by suit, like A♥A♣T♥T♣ and A♦A♠T♦T♠, play the same way, and each of the 270,725 combinations is simulated on its own, so they double as a check on the simulator. Their results started clustering together at around 200,000 trials, and from about 300,000 every version of the best hand, AATT double suited, sat above every version of the next-best hand, AAJJ double suited. At 1,000,000 trials they agree within a few tenths of a point.
A Graph
The vertical lines divide the chart into quartiles. These results are rather interesting as they appear to be a linear transformation of a logistic curve, something found throughout the natural world.

Results From Each Quartile
The worst Omaha hand is 2♣2♦2♥2♠, with 9.31% equity against a random hand. Here is the top hand of each quartile.
| Quartile | Hand | Equity |
|---|---|---|
| 1 | A♥A♣T♥T♣ | 71.65% |
| 2 | T♠T♣5♠3♦ | 53.76% |
| 3 | A♠K♣8♣3♣ | 49.64% |
| 4 | 7♣6♠6♥2♣ | 45.74% |
The Best, and the Worst
And the 10 hands in the middle. The 10 best hands all have preflop equity greater than 70% against a random hand. The hands in the middle are all a little worse than a coin flip against a random hand. And the 10 worst hands can expect to lose more than 70% of the time.
Here some interesting patterns emerge. Double suited aces with TT or JJ are the nuts. Low quads and trip deuces with a mid rank rainbow are the worst. The worst hands are significantly worse than the best hands are good.
Further down, AA55 and AA99 double suited rank level with AAKK: AA55 has 70.77% equity, AA99 70.73% and AAKK 70.67%. We hypothesize the reason is straights. Every straight contains a 5 or a 10, and holding two of the middle cards blocks the straights an opponent needs: opponents beat AAKK with a straight 10.05% of the time, but AATT, AA55 and AA99 only 8.47–8.65%.
| Rank | Hand |
|---|---|
| 1 | A♥A♣T♥T♣ |
| 2 | A♦A♣T♦T♣ |
| 3 | A♠A♥T♠T♥ |
| 4 | A♠A♦T♠T♦ |
| 5 | A♥A♦T♥T♦ |
| 6 | A♠A♣T♠T♣ |
| 7 | A♠A♥J♠J♥ |
| 8 | A♠A♣J♠J♣ |
| 9 | A♠A♦J♠J♦ |
| 10 | A♥A♣J♥J♣ |
| Rank | Hand |
|---|---|
| 135,358 | Q♦9♠8♠5♥ |
| 135,359 | T♣9♠7♥6♥ |
| 135,360 | 8♠8♥5♦2♥ |
| 135,361 | T♦9♦8♠2♠ |
| 135,362 | T♠6♥4♠4♥ |
| 135,363 | A♠K♣8♣3♣ |
| 135,364 | J♠T♦7♥4♥ |
| 135,365 | K♠9♣5♥5♣ |
| 135,366 | A♠T♠4♠4♥ |
| 135,367 | K♠Q♥8♣6♦ |
| Rank | Hand |
|---|---|
| 270,716 | 8♥2♠2♦2♣ |
| 270,717 | 8♦2♠2♥2♣ |
| 270,718 | 7♥2♠2♦2♣ |
| 270,719 | 7♣2♠2♥2♦ |
| 270,720 | 7♦2♠2♥2♣ |
| 270,721 | 7♠2♥2♦2♣ |
| 270,722 | 5♠5♥5♦5♣ |
| 270,723 | 4♠4♥4♦4♣ |
| 270,724 | 3♠3♥3♦3♣ |
| 270,725 | 2♠2♥2♦2♣ |
Find a Hand
Enter a ranking, an integer greater than 0 and less than 1,327, and the site will return the corresponding hand.
Find a Ranking
Enter a hand and we will return its ranking.


Texas Hold'Em
We ran Texas Hold'Em the same way: each of the 1,326 starting hand combinations was tested 1,000,000 times against a random hand. The vertical lines divide the chart into quartiles.
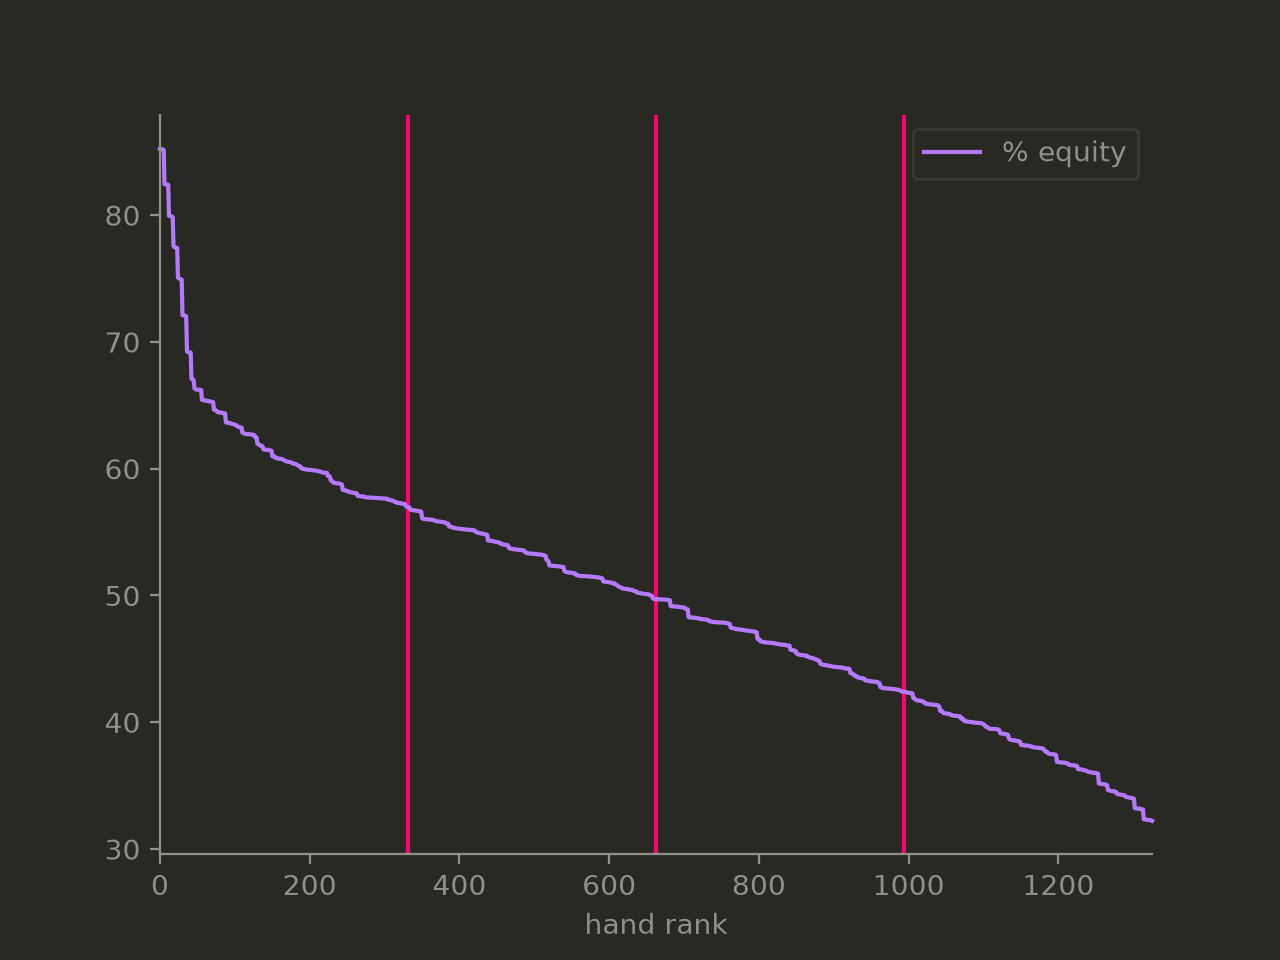
The elbow near hand rank 42 marks the end of the big pocket pairs. AA through 88 take the first 42 spots, 7 pairs with 6 combinations each, and the curve falls steeply through them, about 0.39 points per rank, from 85.19% for AA to 69.19% for 88. From AKs at rank 43 the curve bends into a long, much flatter decline, where suited aces, offsuit broadway hands and the smaller pairs mix together. The smaller pairs drop quickly: 77 starts around rank 47, 66 around 105 and 22 around 633.