The Logistic Curve Formula
The standard logistic curve is σ(x) = 1 / (1 + e−x) It rises from 0 to 1 in an S shape: flat at both ends and steepest in the middle, where σ(0) = 0.50. The general form is f(x) = L / (1 + e−k(x − x₀)) L sets the top of the curve, k how steep it is and x₀ where its midpoint sits.
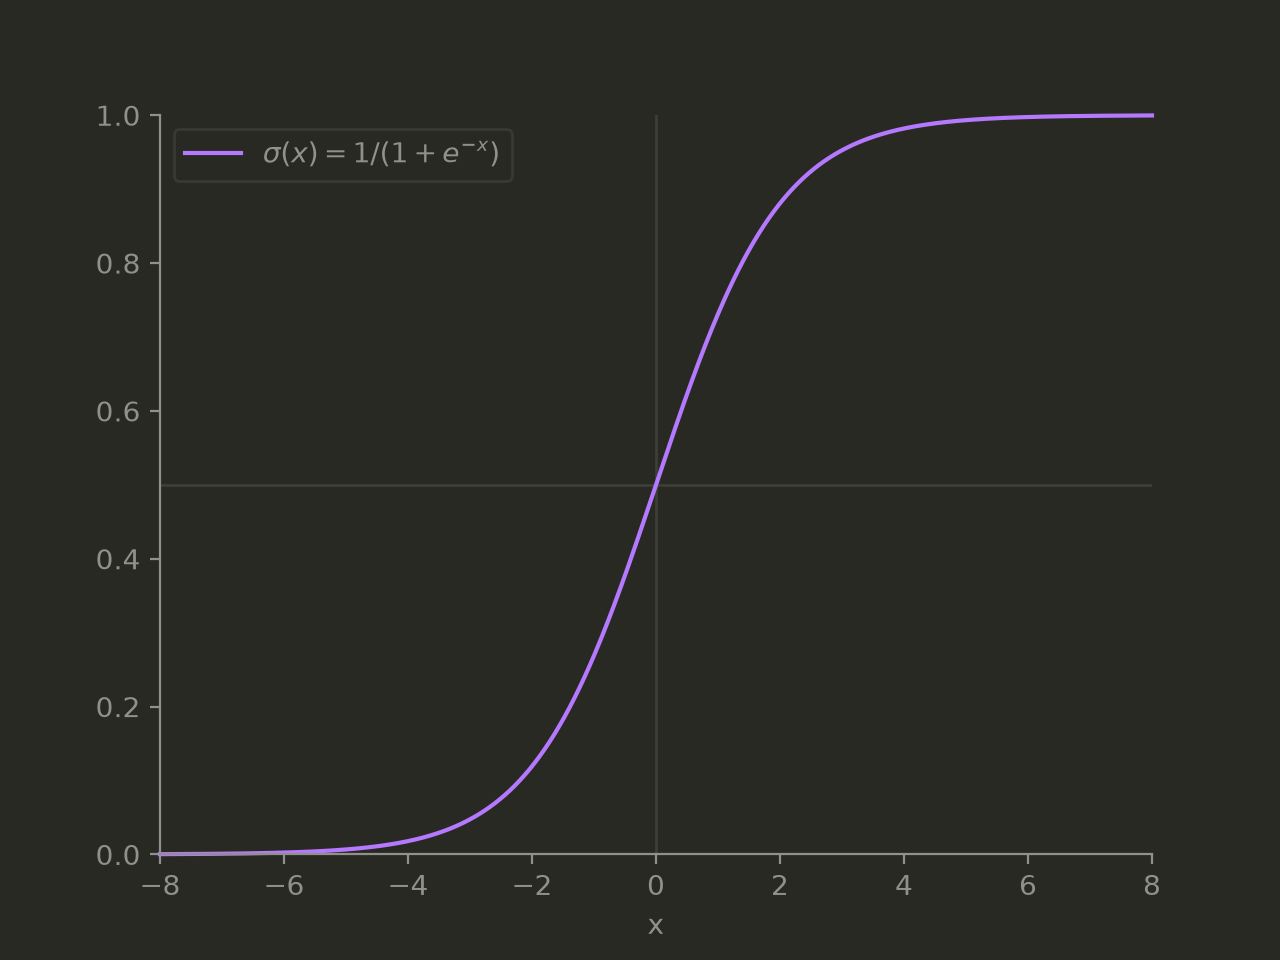
The curve is symmetric about its midpoint, σ(−x) = 1 − σ(x), and it is a shifted and scaled hyperbolic tangent: σ(x) = (1 + tanh(x / 2)) / 2 S-shaped curves in general are called sigmoid curves. The logistic is the best known of them, and in machine learning “sigmoid” usually means σ itself.
Derivative and Inverse
The slope of the logistic curve has a compact form: σ′(x) = σ(x)(1 − σ(x)) It is largest at the midpoint, 0.25, and falls toward 0 at both ends.
The inverse of the logistic is the logit, the logarithm of the odds p / (1 − p): x = ln(p / (1 − p)) The logistic curve turns log-odds into probabilities, and the logit turns them back.
Logistic Growth in Nature
Pierre-François Verhulst proposed the logistic curve in 1838 to describe a population that grows until it runs into a limit. Early on, its growth looks exponential: the more there is, the faster it grows. As it approaches the limit L, the carrying capacity, growth slows and the curve levels off. Exponential growth has no ceiling; logistic growth does.
The same shape turns up wherever growth feeds on itself but uses something up: yeast or bacteria in a fixed supply of food, an epidemic running out of people to infect, an autocatalytic chemical reaction running out of reactant, and a new technology running out of new customers. Dose–response curves in pharmacology, which show how a response rises with the dose of a drug, often have the same S shape.
Logistic Regression and Classifiers
Logistic regression uses the curve to turn a score into a probability. It weighs and adds up the inputs, z = w₁x₁ + w₂x₂ + … + b then reports σ(z) as the probability of a yes. Because the logit undoes the logistic, the model is linear in the log-odds: each input moves the log-odds by its weight. That makes it one of the most widely used binary classifiers: models that answer a yes-or-no question, like spam or not spam, or, at a poker table, whether a player will fold to a bet.
Neural networks used the logistic as their standard activation function for decades. Most now use simpler functions such as ReLU inside the network, but a logistic still turns the final score into a probability for yes-or-no questions.
The Logistic Curve in Our Omaha Data
Our Omaha hand rankings trace the same S shape, turned on its side. Rank all 270,725 starting hands by their equity against a random hand, and the share of hands ranked above any given equity follows a logistic curve: share = σ((50.00 − equity) / 3.51) Solve that for equity and swap the axes, and you get the dashed line below, laid over our data. Swapping axes, stretching and shifting are all linear transformations, so the chart is a transformed logistic curve.
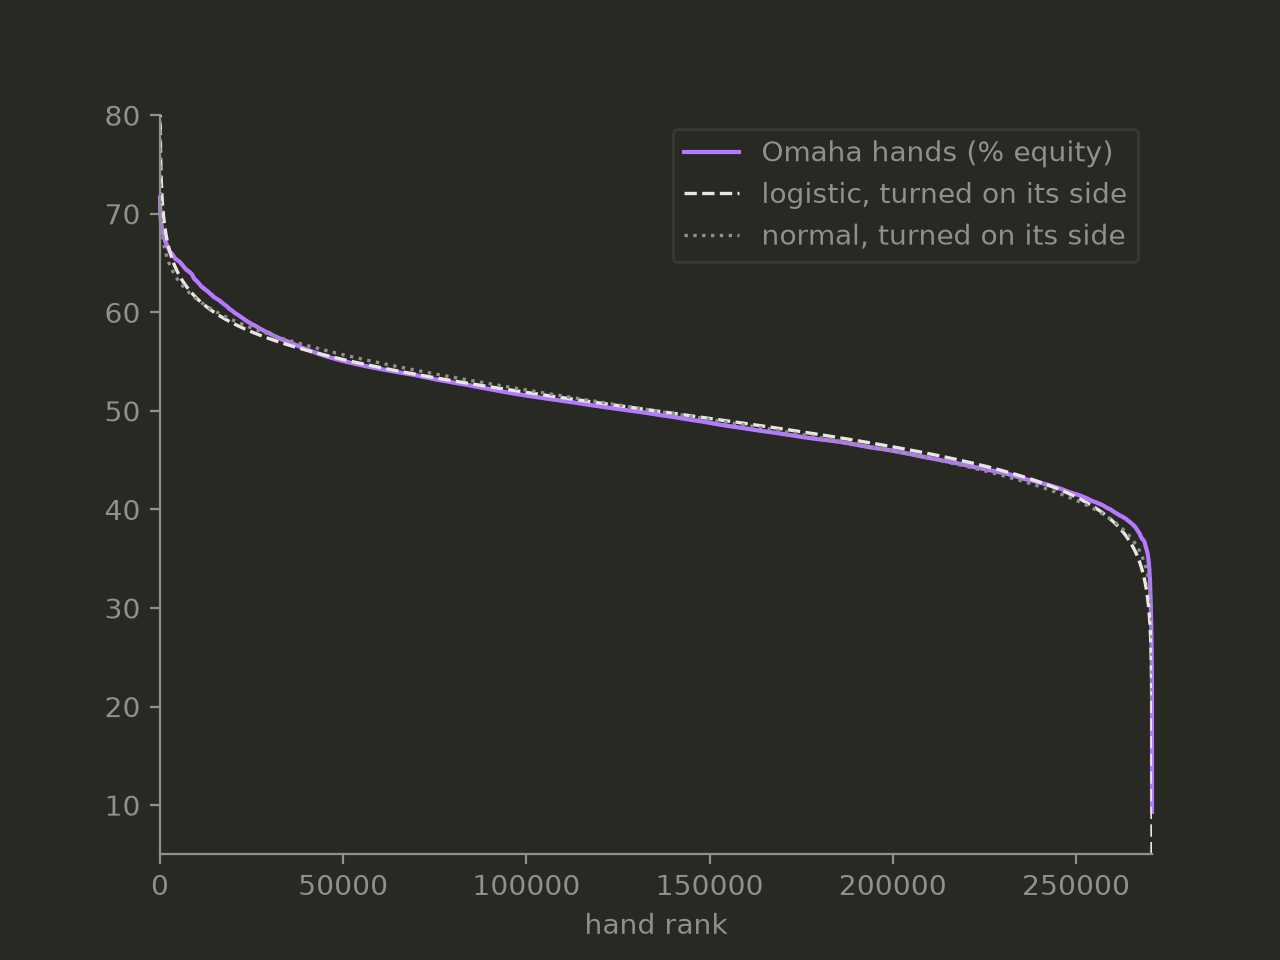
The fit is closest through the middle and departs slightly from the data at the ends, among the strongest and weakest hands.
Logistic vs Normal Distribution
The bell curve has an S curve of its own: the normal cumulative distribution, Φ(x). It is nearly the same shape. Scale the logistic by 1.702 and the two never differ by more than 0.0095: σ(1.702x) ≈ Φ(x)
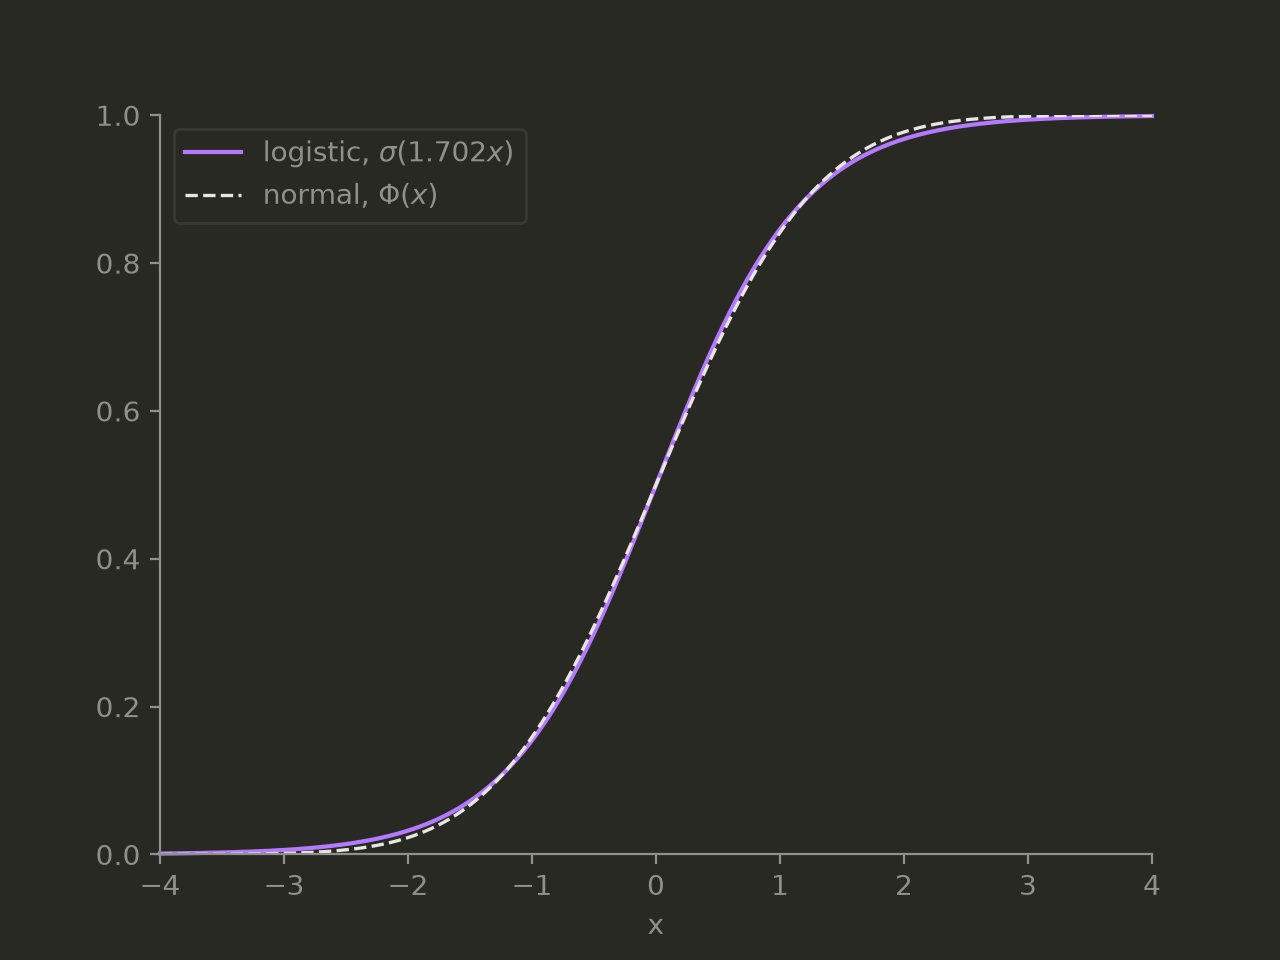
So which one describes our data? Fitted to the same 270,725 equities, the logistic and the normal do equally well: each stays within about 3.5 points of the data’s cumulative share everywhere. Neither fits the ends. More hands are very strong than either curve predicts, and fewer are very weak:
| Share of all hands | Our data | Logistic | Normal |
|---|---|---|---|
| Equity above 65% | 2.09% | 1.37% | 0.91% |
| Equity above 60% | 7.45% | 5.47% | 5.76% |
| Equity below 40% | 4.20% | 5.47% | 5.76% |
| Equity below 35% | 0.37% | 1.37% | 0.91% |
Our equities lean toward the strong side, with a skewness of 0.35, so neither symmetric curve can match both ends. The logistic comes closer for the strongest hands and the normal for the weakest.
Another Check on the Data
Seeing this curve is also a check on the simulation. Every trial pits a hand against a random hand, so across all 270,725 hands the average equity has to come out at 50%. Ours comes out at 50.00%; a bias in dealing or scoring would pull it away from 50.
We would also expect a smooth S-shaped curve centred on 50%, and that is what we see; kinks, flat steps or a shifted centre would point to a problem. Together with the suit versions of each hand agreeing within random noise, these checks don’t prove the numbers right, but they are what correct numbers should look like.
Logistic Curve FAQ
Is the logistic curve found in poker?
Yes. Rank all 270,725 Omaha starting hands by their equity against a random hand, and the curve they trace is a logistic curve turned on its side: the share of hands ranked above any equity follows σ((50.00 − equity) / 3.51). Logistic regression is also a natural fit for poker questions with a yes-or-no answer, such as whether an opponent will fold to a bet.
What is the formula for the logistic curve?
The standard logistic curve is σ(x) = 1 / (1 + e−x) It rises from 0 to 1 and crosses 0.50 at x = 0. The general form is f(x) = L / (1 + e−k(x − x₀)) where L is the maximum value, k the steepness and x₀ the midpoint.
What is the derivative of the logistic function?
The derivative of the logistic function is σ′(x) = σ(x)(1 − σ(x)) It is largest at the midpoint, where it equals 0.25, and approaches 0 at both ends.
What is the difference between a logistic curve and a sigmoid?
A sigmoid is any S-shaped curve; the logistic curve is the most common one. In machine learning, “sigmoid function” usually means the standard logistic function: σ(x) = 1 / (1 + e−x)
What is the difference between logistic and exponential growth?
Exponential growth keeps speeding up without limit. Logistic growth starts out nearly exponential, then slows as it approaches a limit, the carrying capacity, and levels off in an S shape.
Is the logistic distribution the same as the normal distribution?
No, but their S-shaped cumulative curves are very close: σ(1.702x) is never more than 0.0095 away from the normal curve Φ(x). The logistic distribution has heavier tails, with an excess kurtosis of 1.2 against 0 for the normal.
Why does logistic regression use the sigmoid function?
The logistic (sigmoid) function turns any score into a probability between 0 and 1. Its inverse, the logit, is the log of the odds, so a logistic regression model is linear in the log-odds: each input moves the log-odds by its weight.